

Photo by Алекс Арцибашев on Unsplash
Mean, Median, Mode: Essential Guide to Central Tendency Explained
Master the Basics of Descriptive Statistics with Clear Explanations and Practical Examples of Mean, Median, and Mode


Descriptive Statistics is a branch of Statistics that provides description and summarization of the data. This is used to describe the features without coming to any conclusion. One of which is Central Tendency.
Central Tendency measures the central value of the dataset. This provides a single value used to understand the distribution of the dataset. Today we will talk about Mean, Median, and Mode which are part of central tendency.
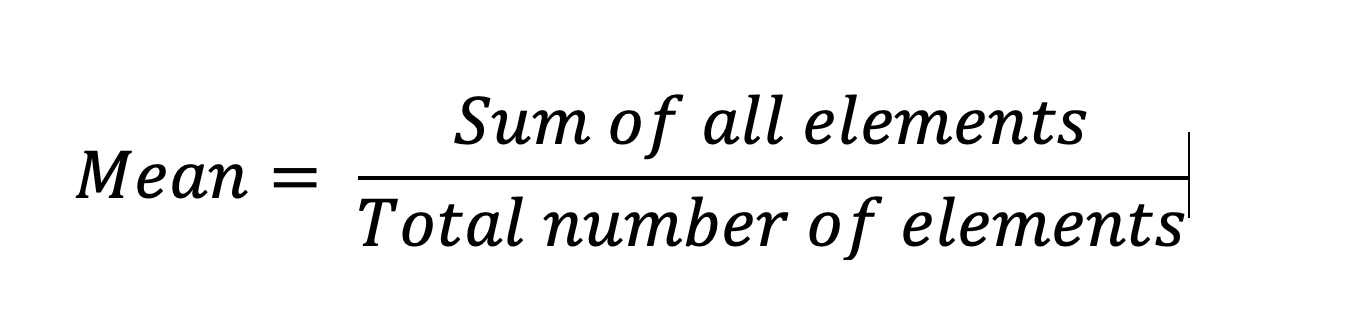
Mean:
This is an arithmetic average of the data in the dataset. It is sum of all the elements by the total number of elements.
- Mean gives a central value of the data which tells if the dataset is balanced.
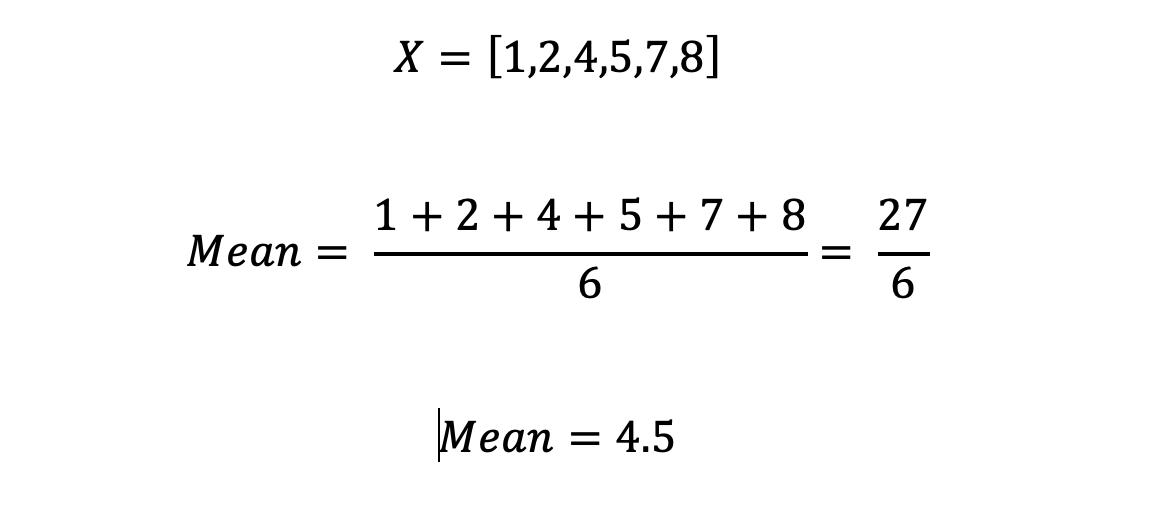
Example:
Characteristics:
Sensitive to outliers: If there are extreme values in the data, mean will be greatly affected.
Used for symmetrical distribution.
Median:
The middle value of the data when the data is arranged in ascending or descending order.
If there are an odd number of elements, the middle value is the median.
If there are even number of elements, the median is the average value of the middle elements.
Example:
If X = [3,5,7], the median is 5.
If X = [3,5,7,9], the median is 6.
Characteristics:
- Not sensitive to outliers.
Mode:
The value that occurs most frequently in the dataset.
If there is one mode — unimodal.
If there are 2 modes — bimodal.
If there are more than 2 modes — multimodal.
Example:
X = [1,2,3,4] — There are no modes.
X = [1,2,2,3,4] — there is 1 mode (unimodal).
X = [1,2,2,3,3,4] — there are 2 modes (bimodal).
Characteristics:
Robust to outliers
Best for categorical data
Let’s Connect!
If you enjoyed this article, a few claps 👏 would mean the world and motivate me to create more!
Feel free to reach out and explore more of my work:
LinkedIn: Pranay Rishith
GitHub: pranayrishith16
Hashnode Blog: Beyond Blog
Medium: Pranay Blog
Looking forward to connecting with you! 🚀